# Search fund success rate — what the data says
Most people enter the search fund conversation with assumptions. Strip those out. Here is what four decades of data actually show.
The [2024 Stanford GSB Search Fund Study](https://www.gsb.stanford.edu/faculty-research/case-studies/2024-search-fund-study) — the most comprehensive longitudinal dataset on this asset class — tracked every U.S. and Canadian search fund formed since 1984. The numbers are specific, the sample is large, and the conclusions are unavoidable. If you are evaluating this path as an operator or an investor, the data should be your starting point, not anyone''s success story.
---
The acquisition close rate
Since 2014, 60% of search funds closed an acquisition. The older cohort — all funds since 1986 — shows 73% delivered positive investor returns.
Those two numbers tell different stories. The 60% acquisition rate means four out of ten searchers spend 12 to 24 months looking and never close a deal. Capital gets returned, with modest search-phase compensation to show for it. The 73% positive return figure covers all completed acquisitions, not all launched searches.
Read carefully: closing a deal is not the same as generating a return. Getting to close is the first filter. Operating the business profitably is the second.
The 2022 Stanford study reported median time to acquisition at 17 months, down from 20 months in the prior study. That compression matters. Shorter search periods lower the dead-weight cost of the search phase — the salary draw, office costs, and investor capital deployed before an acquisition happens.
---
Investor return data
The headline numbers investors cite are well-documented.
The 2024 Stanford study reported aggregate investor IRR of 35.1% and a return on invested capital (MoIC) of 4.5x. The 2022 study showed 35.3% IRR and 5.2x MoIC. The modest dip in MoIC between studies reflects rising acquisition multiples — median purchase price increased from $10 million in 2020 to $16.5 million by the 2022 study period.
For comparison: top-quartile VC funds have historically returned 3x to 4x over 10-year fund lives, with IRRs in the 20–30% range depending on vintage. Buyout PE funds at the top quartile deliver 2x to 2.5x MoIC with IRRs typically in the 20–25% range. Search funds, as an aggregate asset class, beat those benchmarks. The 2024 study data on exited deals shows IRR jumping to 42.9% — deals that reached exit generated substantially higher returns than the all-in average.
Since 1984, the 526 search funds tracked in the 2022 dataset generated approximately $9.8 billion in equity value for investors on $2.3 billion invested. That is a portfolio-level result that institutional asset allocators are now taking seriously.
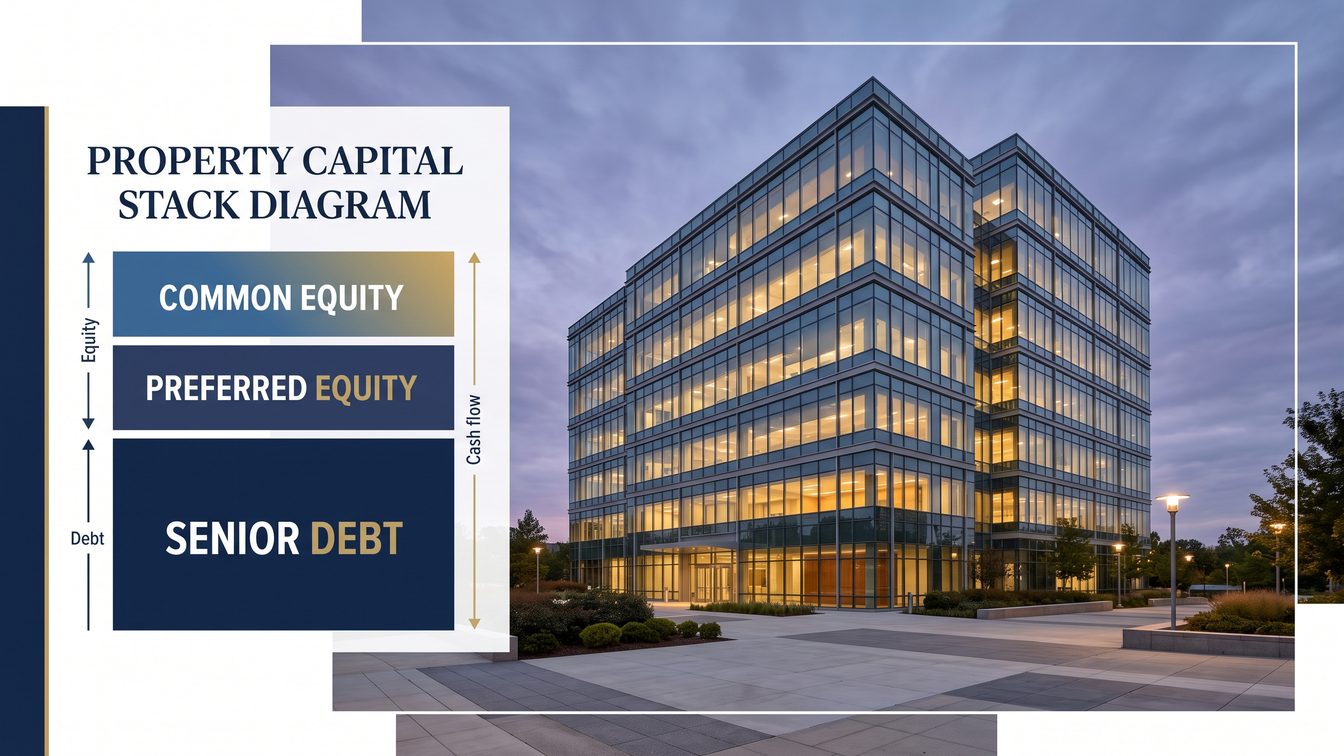
One structural note: search fund investors typically hold preferred equity with liquidation preferences, priority returns, and conversion rights. The 35%+ IRR figures reflect returns after the preferred capital stack is satisfied. The numbers are not inflated by unrealized positions — a meaningful percentage of the tracked funds have reached full exit.
---
The failure distribution
11% of completed acquisitions exited at a loss in the 2022 Stanford data. That number has held steady across multiple study cycles.
What the aggregate numbers obscure: the distribution is wide. The study data on exits shows a small percentage of deals driving a large share of total returns. Only 27 of 166 search fund companies in the 2022 dataset delivered $10 million or more in equity to the operator-CEO. That is 16% of the pool. The median outcome is positive but not dramatic. The right tail — the 10x outcomes — has an average hold period of approximately 10 years.
This is not a uniform return profile. It is a distribution with a thin right tail. Investors who back multiple searches and build diversified exposure capture the asset class returns. Single-fund investors are making a more concentrated bet.
---
What the operator actually earns
The operator-CEO structure is worth understanding precisely. Search fund entrepreneurs typically vest into 25–30% of the common equity in three tranches: one third at close, one third over a four- to five-year ratable vesting schedule, and one third contingent on performance — specifically, delivering investor IRR above defined thresholds that typically start at 20% and climb to 35%.
At a 35% or higher IRR, the operator earns 100% of the performance equity tranche. Below 20% IRR, performance equity is zero. The structure aligns operator and investor interests tightly. It also means that an operator who runs a solid but not exceptional business captures less of the upside than one who delivers top-decile returns.
For an operator running a $20 million acquired business to a $60 million exit over seven years, equity of 25–30% on $38 million in value creation — net of debt and investor preferred returns — can produce a $5–10 million personal outcome. That math works. It also requires sustained execution, not just a good acquisition.
Understanding the full ETA model structure before you start is essential. If you are in the early stages, review [how to start a search fund](/blog/how-to-start-a-search-fund) to understand the capital raise, search phase economics, and acquisition structure before benchmarking yourself against aggregate return data.
---
IESE international benchmarks
The IESE Business School''s International Search Fund report — a concurrent biennial study covering non-U.S. and non-Canadian funds — adds important context. International search funds, as of the 2022 IESE report, showed strong acquisition activity across Europe, Latin America, and Asia-Pacific, with similar structural returns profiles to U.S. funds. The international cohort confirms the model is not a North American anomaly. The fundamental economics — patient investors, disciplined acquisition criteria, operator equity alignment — replicate across markets.
The international data also suggests the asset class is earlier in its development cycle outside the U.S., which may imply better relative deal access in markets where competition among searchers remains lower.
---
Comparing to VC and traditional PE
The comparison that matters most is risk-adjusted return, not raw IRR.
VC investing involves high failure rates at the portfolio company level. Most VC-backed companies return zero or near-zero to investors. The 10x outcomes fund the asset class. Search fund investing inverts that profile: 73% of completed funds yield positive returns, and the catastrophic loss rate on completed acquisitions sits at 11%. The right tail is smaller than VC, but the base rate of positive outcomes is dramatically higher.
Traditional lower-middle-market PE operates with larger deal teams, higher management fees, and institutional overhead costs that compress net returns to LPs. Search funds run lean. The operator is the management team. There is no portfolio company overhead beyond the acquired business itself.
The risk profile search funds carry is execution risk, not binary company risk. Investors are betting on a specific operator''s ability to run a specific business. That is a knowable risk in ways that early-stage startup risk is not.
---
What the data tells you to do
The 35% IRR and 4.5x MoIC are real. So is the 40% failure-to-acquire rate and the 16% shot at a $10 million operator outcome.
Do not enter this asset class — as operator or investor — on the basis of headline numbers. Enter it on the basis of the full distribution. Know that most search funds do not close deals. Know that most operators who do close do not hit the top tier of returns. Know that the investors who do best are those with diversified exposure across multiple searches, not one-off bets.
The asset class has a 40-year track record, hundreds of data points, and two rigorous academic institutions publishing updated studies every two years. That is more than most alternative investment categories can claim.
Use the data. Make the decision with the full picture in front of you.
---
*Sources: [2024 Stanford GSB Search Fund Study](https://www.gsb.stanford.edu/faculty-research/case-studies/2024-search-fund-study); 2022 Stanford GSB Search Fund Study; IESE Business School International Search Fund Report 2022; Yale SOM, "Exploring Search Fund Entrepreneur Economics" (2023).*
Frequently Asked Questions
What percentage of search funds since 2014 successfully closed an acquisition?
Since 2014, 60% of search funds closed an acquisition. The remaining four in ten searchers spent 12 to 24 months looking and never closed a deal. Capital gets returned to investors, with modest search-phase compensation as the only result for the operator.
What investor return figures does the 2024 Stanford study report for search funds?
The 2024 Stanford GSB Search Fund Study reported aggregate investor IRR of 35.1% and a return on invested capital of 4.5x. For deals that reached a full exit, the IRR figure rises to 42.9%. These figures reflect returns after preferred capital is satisfied and are drawn from a dataset that includes a meaningful percentage of fully exited funds.
How does the search fund failure rate compare across completed acquisitions?
11% of completed acquisitions exited at a loss in the 2022 Stanford data, and that figure has held steady across multiple study cycles. By contrast, 73% of all completed funds delivered positive investor returns. The catastrophic loss rate is substantially lower than in early-stage venture capital, where most portfolio companies return zero or near-zero.
What equity stake does a search fund operator typically earn and how does it vest?
Search fund entrepreneurs typically vest into 25% to 30% of common equity in three tranches. One third vests at close, one third vests over a four- to five-year ratable schedule, and one third is contingent on performance tied to investor IRR thresholds that typically start at 20% and climb to 35%. At 35% IRR or higher, the operator earns the full performance equity tranche.